

Vaccines hold back the tide as latest wave shows signs of approaching peak
June 17, 2021

This article has not been updated recently
According to ZOE COVID Study figures, it is estimated that among unvaccinated people in the UK there are currently 12,830 new daily symptomatic cases of COVID on average, based on PCR test data from up to five days ago [*]. An increase of 28% from 9,991 last week. Comparatively there are currently 2,930 new daily symptomatic cases in partly or fully vaccinated people, an increase of 53% from 1,917 new cases last week (Graph 1 below). The data shows that the positivity rate is much higher in those with just a first dose, compared to those who are double vaccinated (Graph 2 below).
The ZOE COVID Study incidence figures (new symptomatic cases) are based on around one million weekly reporters and the proportion of newly symptomatic users who have received positive swab tests. The latest survey figures were based on data from 5,714 recent swab tests done between 30 May to 12 June 2021. The data excludes the lateral flow tests.
In terms of prevalence, on average 1 in 340 people in the UK are currently estimated to have symptomatic COVID [1] (Table 1 below).
The UK R value is 1.2 and regional R values are; England, 1.2, Wales, 1.2, Scotland, 1.2 (Table 1 below). All R values have fallen from last week, suggesting the rate of increase in new cases may have slowed down.
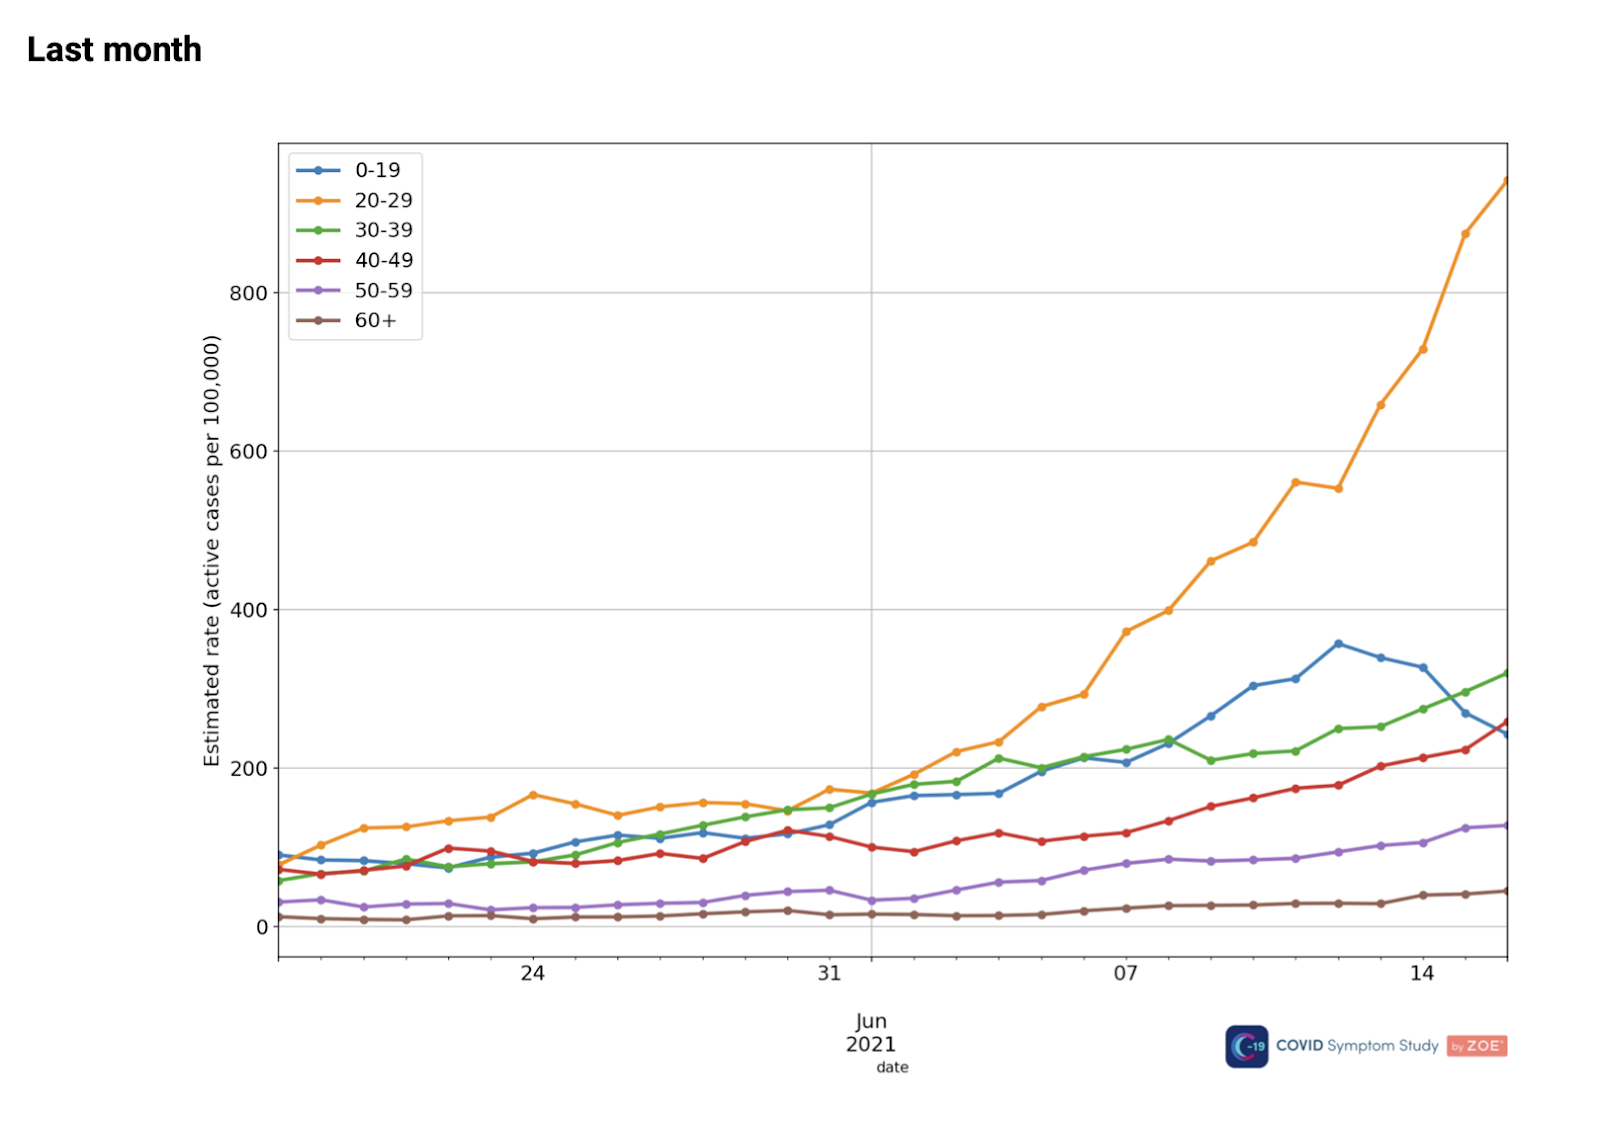
According to the prevalence data by age, the number of new daily cases in the 0-19 age group has started to fall but cases continue to increase in the 20-29 age group (Graph 5 below).
According to our data, a small proportion of those who have been vaccinated still get infected. ZOE collected reports last week from 329 contributors who had an infection after two doses of the vaccine, and 214 who reported an infection after one dose. The following approximate risk factors for infection based on one, two or zero doses of the vaccination, have been recorded using the latest ZOE data:
- Current risk of new daily COVID infection
- in the unvaccinated: 1 in 2,093
- after 1 vaccine dose: 1 in 5,508
- after 2 vaccine doses : 1 in 16,101
This data shows that when people have received both vaccinations they have much greater protection against COVID-19.
The ZOE COVID Study Local Authorities' Watch list for Active Cases of COVID-19
The following are UTLA regions with the highest estimates of prevalence rates averaged over the past week. Please note, that the local authorities' watchlist is intended to be an early indication system of areas where cases might be rising, but these prevalence estimates might be volatile due to the limited amount of responders and positive cases in some areas.

Tim Spector OBE, lead scientist on the ZOE COVID Study app and Professor of Genetic Epidemiology at King’s College London, comments on the latest data:
“The numbers this week seem to be slowing down, which is good news. Worrying areas with a high number of cases like Scotland, and the North West are starting to level off. Wales in particular has seen tangible benefits from a faster than average vaccination rate, where they previously had some of the highest rates in the country, we are now seeing clear protection against rises. Wales is now several weeks ahead of the rest of the UK in terms of vaccinations, so it looks like the rest of us will soon follow suit. I’m predicting based on past experience, that although we may not have reached the peak quite yet, within 2 weeks we will see cases beginning to drop again.
Boris Johnson’s decision this week to delay the lifting of all restrictions in the UK, was a difficult but probably necessary one. It’s good to see decisions being made from the data, not dates. Life is better than it was, where we can go out and see friends and family, so having a few more weeks will give us the time and space to get more people vaccinated. We have already seen that being fully vaccinated dramatically reduces both the likelihood of contracting the virus, as well as severity of symptoms, so it’s crucial that everyone eligible for the vaccine gets the first or second jab as soon as possible.”
Professor Tim Spector gives more detail, including the top symptoms reported in the ZOE COVID Study app, in his weekly video update on YouTube here.
The app is delivered in collaboration with King’s Health Partners, an Academic Health Sciences Centre based in South East London.
Graph 1. Daily new cases of COVID in UK by vaccination status

Graph 2. Positivity rate in vaccinated (1st and 2nd dose) and unvaccinated

Table 1. Incidence (daily new symptomatic cases)[*], R values and prevalence regional breakdown table

Please refer to the publication by Varsavsky at al. (2020) for details on how R values are calculated
Graph 3. The ZOE COVID Study UK Infection Survey results over time

The ZOE COVID Study map of UK prevalence figures

Graph 4. The ZOE COVID Study daily active cases by region in the last month

Graph 5. Daily prevalence rates by age group


.png)


.jpg)


.png)


%202.png)
.png)


.png)


%20(1).png)


