

COVID reaches new highs for 2021
October 21, 2021

This article has not been updated recently
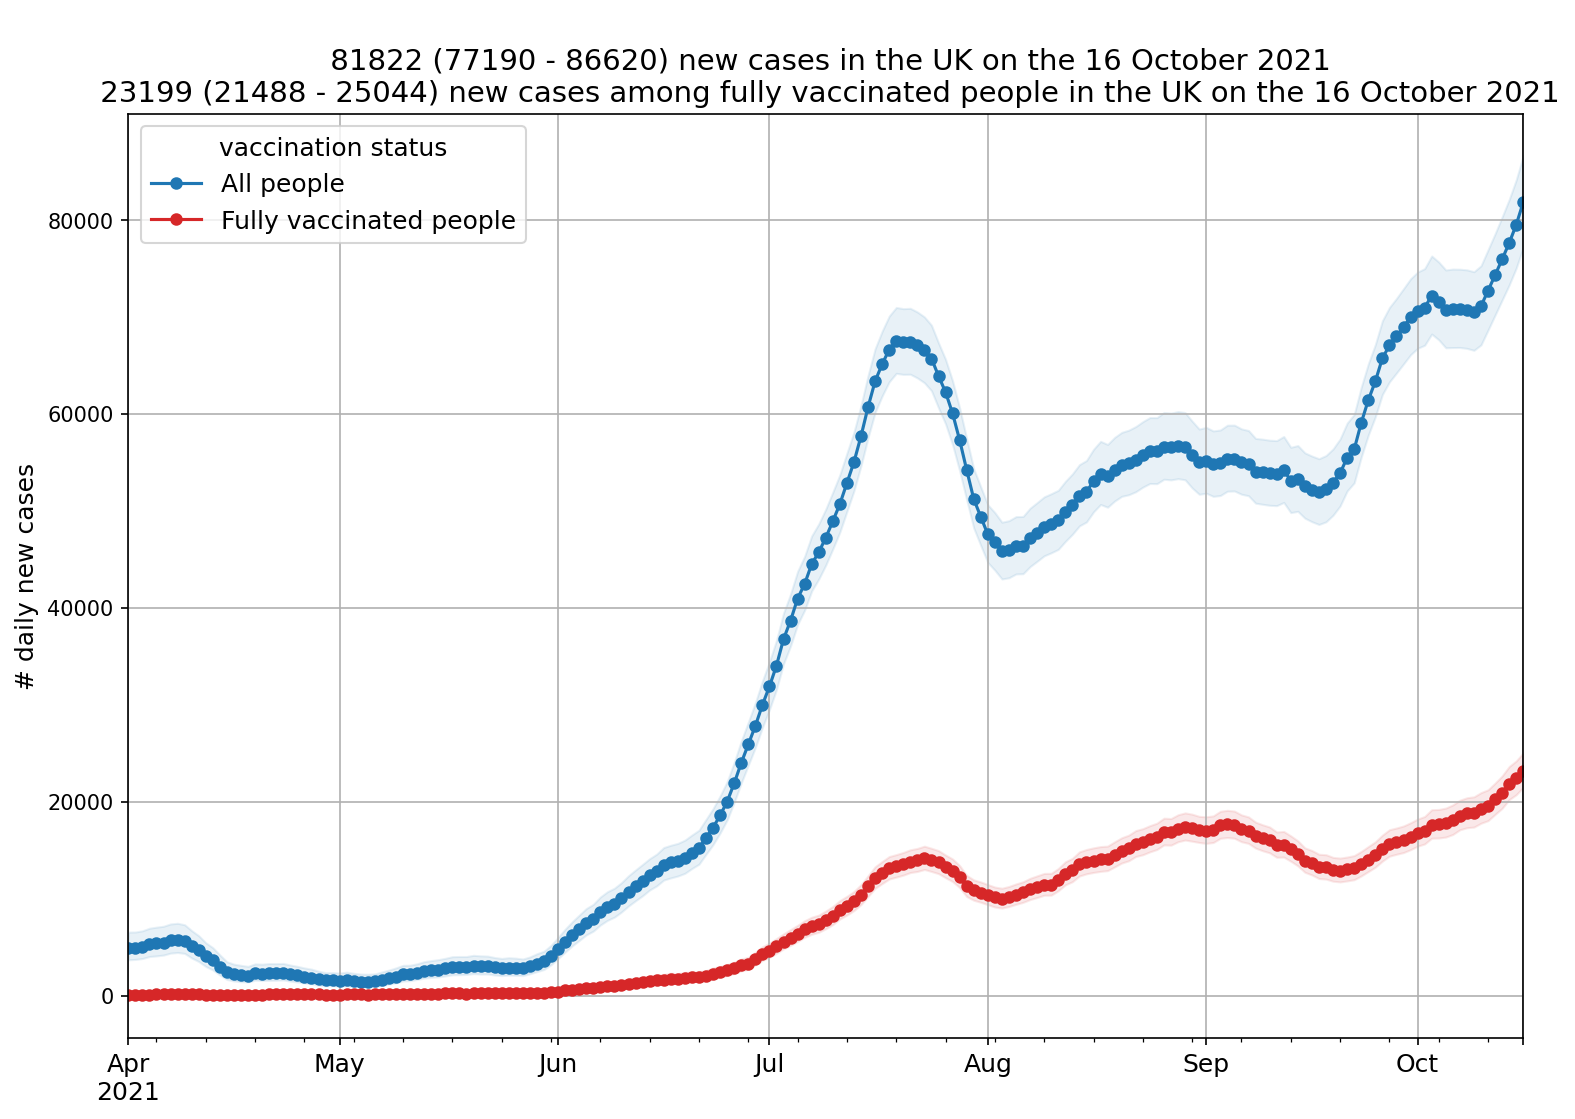
According to ZOE COVID Study incidence figures, in total there are currently 81,823 new daily symptomatic cases of COVID in the UK on average, based on PCR and LFT test data from up to five days ago [*]. An increase of 17% from 69,993 new daily cases last week.*
In the double vaccinated population cases continue to rise and it’s estimated there are currently 23,199 new daily symptomatic cases in the UK up from 18,817 cases last week (Graph 1).
The UK R value is estimated to be around 1.1 and regional R values are; England, 1.0, Wales, 1.0, Scotland, 1.1 (Table 1).
The ZOE incidence data is always a week ahead of the other surveillance surveys and continues to work as an early warning signal. The ZOE data has been reporting an uptick in cases for the last month and the latest ONS figures also reflect this trend (Graph 5).
In terms of prevalence, on average 1 in 63 people in the UK currently have symptomatic COVID. In the regions, England, 1 in 63. Wales,1 in 49. Scotland, 1 in 88. (Table 1).
The number of daily new cases is on the rise across all age groups. Cases in 0-18 year olds have bounced back and are higher than ever. In the 35-55 year old group cases are also climbing. While not climbing at the same rate, we now observe increasing incidence in the more vulnerable age group (55-75), which is cause for concern (Graph 2).
In terms of prevalence, cases are highest in Wales, Midlands, North West and North East. (Graph 3).
ZOE’s predicted Long COVID incidence rate currently estimates, at current case rates, 1,122 people a day will go on to experience symptoms for longer than 12 weeks (Graph 4).
The ZOE COVID Study incidence figures (new symptomatic cases) are based on reports from around 750,000 thousand weekly contributors and the proportion of newly symptomatic users who have received positive swab tests. The latest survey figures were based on data from 41,851 recent swab tests done between 2nd October and 16 October 2021.
Professor Tim Spector, lead scientist on the ZOE COVID Study app, comments on the latest data:
“With over 80,000 new cases a day the UK really is in trouble. This hasn’t happened overnight, but frustratingly our calls for a more cautious approach to COVID management have gone unheeded, despite the upward trends we’ve reported now for several weeks. As feared, cases have spilled over into the older age group which will certainly lead to more hospitalisations and deaths. The UK needs to act now to prevent the situation from escalating out of control ahead of winter.
The two main reasons we’re seeing cases back at January peaks are the UK’s flagging vaccine programme, which has failed to get more than 67 percent of the population double vaccinated, and lifting most restrictions too early. As the ZOE COVID Study shows, the majority of new cases in the UK are in the unvaccinated. More needs to be done to encourage, cajole and educate people into getting their jabs, and support those who need them to get their booster shots. I’d also welcome the return of simple measures, such as wearing masks on public transport and in crowded, poorly-ventilated places, avoiding large indoor gatherings and working from home where possible. Unfortunately, the government’s refusal to take COVID seriously since ‘Freedom Day’ has only encouraged the idea that COVID isn’t worth worrying about. Doing nothing now will just make it worse. This pandemic is far from over, and whilst it seems some would rather bury their heads in the sand, COVID-19 and its new variants have other plans.”
Graph 1. The ZOE COVID Study UK incidence figures results over time; total number of new cases and new cases in fully vaccinated
Graph 2. Incidence by age group

Graph 3. Prevalence by region

Graph 4. Predicted Long COVID incidence over time
Please refer to the publication by Thompson at al. (2021) for details on how long covid rates in the population are modelled

Graph 5. A comparison of prevalence figures; ZOE COVID Study, and other COVID surveillance studies

Table 1. Incidence (daily new symptomatic cases)[*], R values and prevalence regional breakdown table

Map of UK prevalence figures


.png)


.jpg)


.png)


%202.png)
.png)


.png)


%20(1).png)


